


VeChain Price Draws Uptrend but Intraday Happens to be Turn Down

VeChain that was seen trading amongst the top 30 cryptocurrencies of the market is now trading amongst the top 25 cryptos of the market, after a week of substantial strengthening, while currently lies at $0.0160. Moreover, earlier this year (August 2020), VET was seen hitting a fresh All-Time High above $0.0200 and currently trades with a pullback of 20% with a bearish candlewick.
However, the price trend of VeChain is drawing two different controversial understanding with respect to change in time frames. VET coin appears drawing a bearish leg as the higher low pattern continues while an uptrend extends from the beginning of the previous month.
As per the VeChain price prediction and the technical analysis, the momentum looks strong, and the major resistance lies at $0.018 and $0.020, with the major one lying at the ATH that was hit back in the previous quarter at $0.022. Alongside, the coin has strengthened from a monthly low of $0.0085 to hit a high before the onset of the ongoing month at $0.0190, showing a growth of over 120%.
VeChain Draws Strong Uptrend with Key Support at $0.013
 CoinNewsSpan
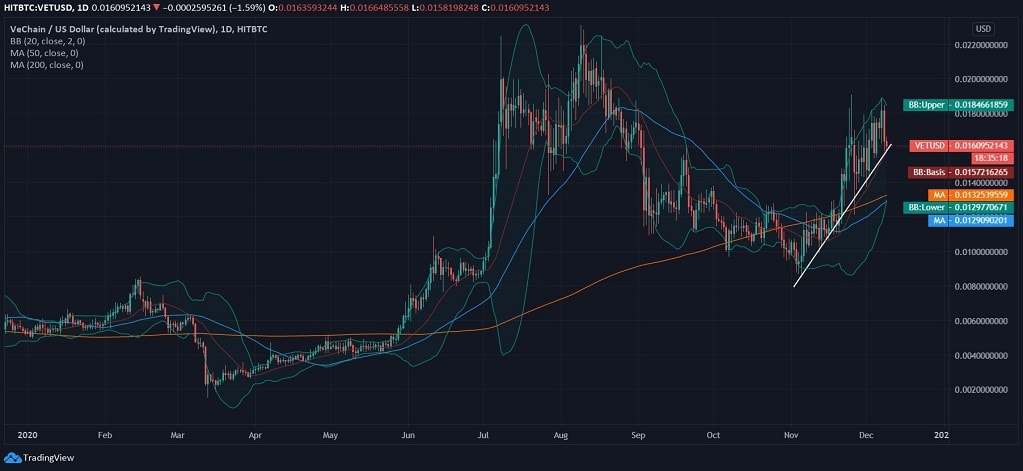
At the press time, VeChain was seen trading with a 20% pullback from the ATH, and the coin currently trades at $0.01609. The uptrend drawn straight from the 4-month support of VET price marked at the onset of the previous month at $0.0085 has led to breaching the upper band, and retain complete support from 50-day and 200-day MA at $0.0129 and $0.0132, respectively on the daily chart.
The price of VeChain happens to be short-term volatile as the Bollinger Bands expand gradually. Although the coin reflects positive sentiment on the daily chart against the greenback, we cannot ignore the fact that the intraday bearish candlewick is drawing a negative divergence.
VET/USD Drawing a Bearish Crossover on Intraday Chart
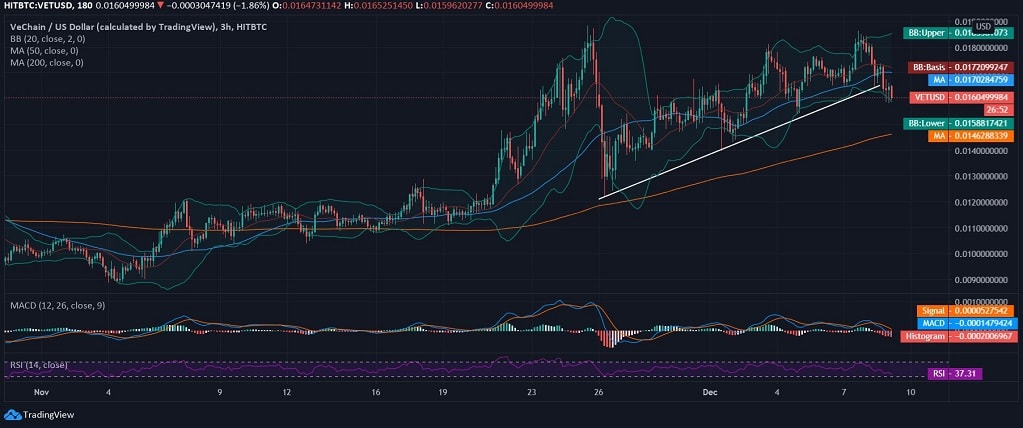
VeChain’s higher low pattern extends for the 2nd week, and in this regard, the bearish leg in the intraday has led to drawing a bearish crossover on the 3-hourly MACD chart as the signal line takes over the MACD line. In this respect, the RSI is also seen sliding towards the oversold region and lies at 37.31 after the price slash.