


Forex Strategy Guide’s Introduction to Bollinger Bands Forex
Bollinger Bands, developed by John Bollinger, are easily adaptable, practically applied tools available for technical analysts and traders in all markets, including forex. As traders in the market need to estimate the price action, the Bollinger Band helps provide the market insights, which allows the traders to assess the market conditions through technical analysis of volatility and trend changes. These act as guidelines for traders to reposition themselves in the market, making gradational price moves for net profits.
Forex trading or Foreign exchange/FX/Currency trading is a platform where one can trade currencies from all over the world. In forex markets, there are two forms of currencies involved in the transaction; for example, the most traded currency pair is EUR/USD. Here, the trader is given two options that are to buy and sell. The first currency in the pair (Base) is always sold according to its estimated worth in the second currency (Counter). In other words, if it is USD/JPY, the US dollar is sold according to its Japanese currency equivalent, the Euro is sold according to its worth in US dollars. This allows a trader to make transactions by buying and selling different currencies at a beneficial price point, making a financial gain.
The same trading strategy is applied for trading any asset. If a trader expects the price of a currency to go up, they will buy the currency. If they expect the currency’s price to go down, they will sell the currency and determine the market’s direction.
What Are Bollinger Bands?
Bollinger Bands help in understanding the market environment through expansion and contraction in the bands in the chart overlay, which act as a technical analysis indicator to a trader in measuring market volatility.
As they depend on varying trends, which define the direction and the volatility of the market, They provide an insight into a decrease in the demand and changing patterns of the economy. Helping the traders position themselves according to the analysis and eliminate the high level of risk by calculating the market conditions, which predict whether a price may reverse after it has become relatively high or low compared to its recent average. This could help the individual to fully understand the risks before deciding to buy or sell an asset.
To give this information, Bollinger Bands uses various technical analysis tools and volatility indicators or channels, where the band follows a standard deviation as a statistical measure, which helps in understanding the resistance and support levels.
Once the central measure of price is defined, the volatility channel plots upper and lower bands Bollinger or lines which contract and expand according to the market’s volatility and also give information about elements, such as:
- Potential price targets or ups and downs in the market
- Periods of market coalition
- The uncertain period in market trading
- Performance of trend and downfall of trend
How does the Bollinger Band Work?
Bollinger Bands consist of three bands, which are-
- An Upper Band
- Middle Line And
- Lower Band
The Bollinger bands or trading bands act as a tool to measure risk and may involve statistical analysis based on Simple Moving Average or SMA. The upper and lower band are set at a distance of two standard deviations, above and below the simple 20 day moving average. The price is mostly held within the Upper band SMA (plus two standard deviations) and Lower band SMA (minus two standard deviations).
Hence, the bands depict the market volatility based on the average, and generally, the price breaks happen between three lines, where the middle line is used as a reference. The standard interpretation to measure highs and lows are as follows
- The upper band indicates a level that is statistically high or expensive
- The lower band indicates a level that is statistically low or cheap
- The Bollinger band correlates the width to the volatility of the trade
For example, if the Upper and Lower bands are making one standard deviation, the recent 68% share of money in the trade is contained within these bands.
The upper band includes overbought investments, while the lower band constitutes oversold investments based on the simple moving average of prices. The Bollinger Bands, when used in combination with other analytic tools, provide a better picture of the current state of a market or security. And they help spot a safe range of prices in trade, ensuring security, and many marketers use Bollinger Bands to study the currency pairs in the range of two bands while trading forex.
How are Bollinger Bands Used in Forex Trading?
The Bollinger Bands act as excellent trading tools to measure volatility. They simplify the browsing experience by setting certain trading guidelines. They indicate levels of outer boundaries, where the price is considered relatively high or low compared to its recent moving average. At the same time, the central line represents the simple moving average prices. The interval between the simple moving average and the outer boundaries is calculated using standard deviation techniques, using the middle band’s data.
The price generally ranges between the upper and lower extremes. This means when a Bollinger band contracts, there is less volatility in the market, and when there is an expansion of bands, the market becomes more volatile. At these times, traders may buy at the support trendline or sell at the resistance trendline for a given stock or option. The standard rule of thumb that can be followed is, prices are said to be overbought on the upside when they hit the upper band and oversold on the downside when they hit the lower band.
Bollinger Bands are generally based upon a 20-period simple moving average. The 20-period SMA acts as a guideline for setting the outer boundaries or bands based on standard deviation. The typical setting Bollinger Bands share is 2%, which means that the outer bands share 2% deviation from 20-period moving average line generally indicates the price-line’s downfall. However, the 20 period SMA is dynamic, and trading can be experimented with the values.
The other technical indicators used are:
M Tops
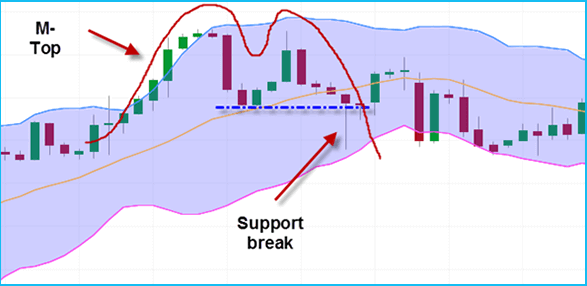
The M tops are similar to a double top with a slight difference in the reaction highs. The highs are not always equal as the first high can be higher or lower than the second high, and the non-confirmation happens in three steps: Firstly, the instrument copies a reaction high above the upper line. The second step is to pull back to the middle line, and the third step is where the price moves higher but does not reach the upper band, representing the trend reversal or support break.
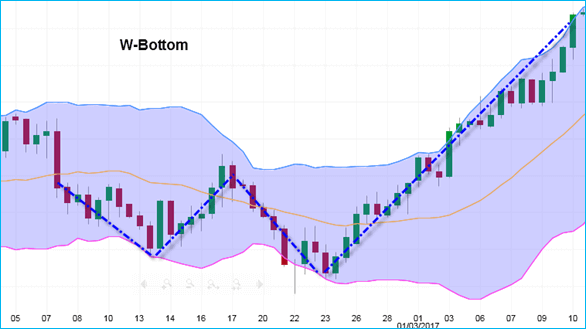
W Bottom
W bottom is where the second low is lower than the first but holds above the lower band. It involves four steps: Firstly, forming a reaction low forms, which are low but not necessarily below the lower Bollinger Band. The second step is to bounce toward the middle band, and the third step is setting a new price low on the instrument. Finally, place a confirmed pattern with a strong move off the second low and the resistance break, forming a downtrend that involves two lows.
Walking the Bands or Riding Bands
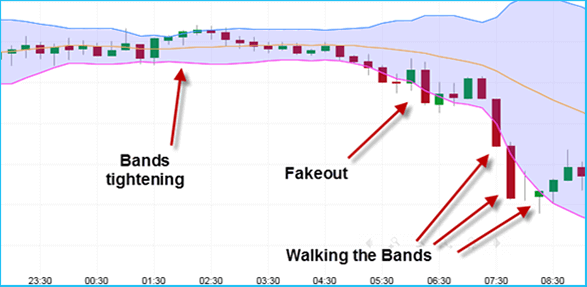
Walking the Bands means forming moves that may reach or exceed the bands, such as moving to the upper band shows strength, while a decline to the lower band shows weakness. The prices can walk the band, hitting various bands during a strong uptrend, which requires greater price action in trading, the strong uptrend comprises numerous upper line tags, and during the uptrend, the price actions never hit a lower band.
Reversals with Bollinger Bands
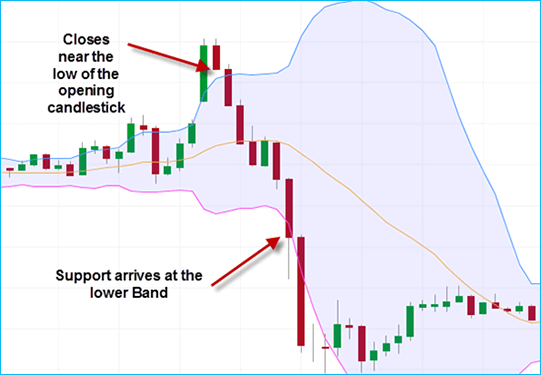
The other characteristics of the trading tools are the instruments used tend to blur when they are not range-bound. For example, in candlestick analysis, instead of trading at the upper limit, wait to see if there is scope for betterment in the performance. If the instrument tends to give in space and close near a low, the trading tends to improve sooner.
The other key strategies include:
- Day Trading Uptrends with Bollinger Bands
Here the tools are used to calculate the asset’s potential to rise when there is downfall or reversal of the trend, and if the uptrend is strong in competition, it tends to reach the upper limit and signal the traders for buy-ins.
- Day Trading Downtrends with Bollinger Bands
Here the tools are used to calculate the asset’s potential, which is falling when there is a rise in a trend. Though there is a reversal of the upside trend, the price will always hit the lower limit declining to a strong downtrend.
How to Trade Forex with Bollinger Bands?
There are several different techniques of using Bollinger Bands to trade the forex markets. The most popular are:
- Using Market Trends: Traders make an analysis to identify entry signals using the bands to measure support and resistance.
- Bollinger Squeeze: Applying the volatility indications of the bands and studying their performance at the forex market.
Trading the Trend
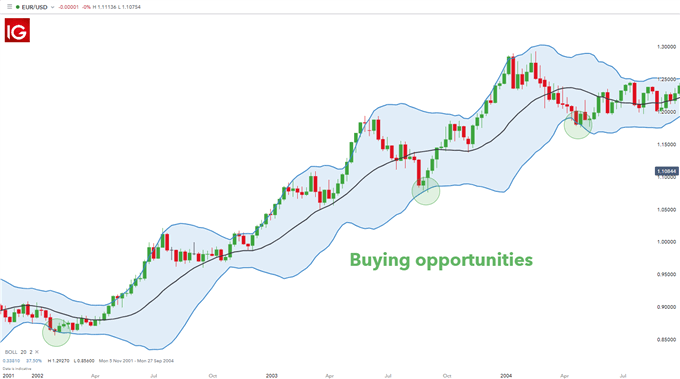
The chart above represents EUR/USD uptrend; it is easy to follow based on simple trading strategies. Firstly, a trader needs to identify the trend and then use the two bands, which are upper and lower band combined with price movement, which gives an idea about the Bollinger Band’s entry points as a referred target level.
Usually, when using a Bollinger band as an indicator, the lower band is referred to as a gauge of support while the upper band is called resistance. The given strategy is used in defining the uptrends and downtrends in the forex. When the price hits the lower band, traders open a trading account or long buy, and the profit or losses depend on the upper and lower bands changing according to the trend.
Trading the Bollinger Bands Squeeze
Here, the lines are contracted, indicating less volatility. The Bollinger squeeze represents the breakouts above or below the band depending upon the trend and gives safe entry points to make investments. The Bollinger Band squeeze means a contraction in the band, signaling the trading breakout like fluctuations in price levels, increase and decrease, and deviation from moving average.
The Bollinger Band squeeze is one of the most reliable signals. They signal low volatility or contraction in bands, closing prices or trading when it hits moving average, and indicating the breakout based on the trend.
Bollinger Bounce
Bollinger Bounce is when there are high levels of fluctuations due to dynamic support and resistance levels. The trader waits for the terms to return to the middle of the bands or conditions where they are not expanding or contracting.
What is the best setting for Bollinger bands?
Bollinger and RSI
The Bollinger Bands are recommended to combine with other tools to make safe investments in forex as sometimes though the reactions are not as intense, the traders can still lose the profits. Hence, the Relative Strength Index or RSI helps in confirming the relative trends strength.
The values range between 0 to 100, and the RSI calculates the number of days when it is closed down and closed up, giving approximate values of overbought and oversold territories. This price chart lays out the investment objectives with the possible outcomes making it easy to follow the forex trade.
Bollinger and MACD
MACD is another tool that indicates the overbought and oversold indicating a trend reversal. It includes trading divarications and new highs, which means that the higher prices in forex are in decline, and they may soon adjust.
The Bollinger Bands state a comparative definition of volatility. They are generally used to compare the two bands and trend lines before making rigorous buy and sell decisions on trading platforms. The trading band comparison is based on several factors such as momentum, volume, sentiment, open interest, inter-market data, etc.
The Bollinger Bands have already been considered in understanding the trend and changing patterns in trading, so their use for confirmation of price action is not recommended. And the indicator used should not be directly related to one another. For example, the one momentum or one-volume indicator successfully, but two-momentum indicators aren’t better than one.
The key to predicting successful volatility breakout systems is understanding the Bollinger Bands closing outside the continuations, not reversal signals. The prices can also be unpredictable as they walk up the upper Bollinger Band and down the lower Bollinger Bands. M-tops and W-bottoms, momentum shifts, etc., act as a reference in analyzing changing price patterns
Are Bollinger Bands useful?
The Bollinger bands are described as flexible tools suitable for all investors, as the traders use Bollinger Bands to gauge the trends, but they cannot use the tool alone to make price predictions. Because one must remember, there are a few limitations that traders should consider before using them. Though Bollinger Bands are helpful tools for technical traders, kindly remember that they may not be suitable for all as the Bollinger Bands indicator relies on theory, not fact.
One of the limitations states that the Bollinger Bands are primarily reactive, not predictive. The bands will change according to the transition in price movements, either uptrends or downtrends, but this will not help predict the price movements. As with most of the technical indicators, Bollinger Bands are a slow indicator. This is because the tool is based on a simple moving average, which takes the average price of several highs and lows considerations.
John Bollinger, the Bollinger Bands developer, recommends that in order to make the system suitable for all investors, the tool must be used along with two or three non-correlated tools that provide more direct market signals. While many traders use the bands as a mere technical indicator, others inculcate different indicators or different trading strategies depending upon the desired objective.
Conclusion
The use of Bollinger Bands and their effectiveness may vary from one industry to another, as there are different sets of guidelines that define the uptrend and downtrend in every sector. According to which the use of tools is altered. The Bollinger Band like cookie policy that varies on each website caters to different settings like assessing the position, determining the volatility and breakout that may happen, and evaluating the entry and exit positions to make maximum benefits. Likewise, the selected tool needs to be adjusted according to the preferences and used in the related industry’s best setting.