


Electroneum (ETN) Appears Flat as it Trades at $0.00185

Electroneum appears slightly bearish as it currently trades at $0.00185 and has failed to retain support from 50-day and 200-day daily Moving Averages. The price trend of ETN has shifted below 38.20% Fib Retracement level and is experiencing price accumulation. The coin spiked to $0.00560 and bottomed out at $0.00126 since the starting of the year until the time of writing. Overall, Electroneum had faced a trend reversal since the 2nd week of the previous month.
Electroneum (ETN) Price Shows Bearish Signs, Support Under Threat
 CoinNewsSpan
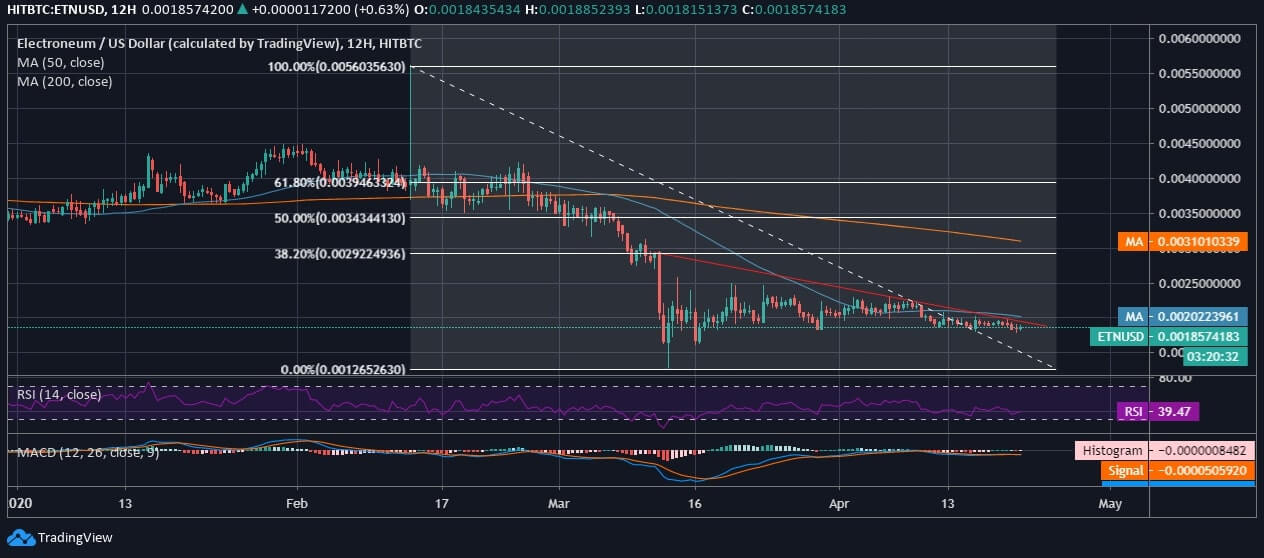
On the 12-hourly chart, Electroneum is seen accumulating after a trend reversal in the previous year against the US Dollar. Although it has retreated above the monthly low as is currently trades at $0.001857, but is yet to retain support from daily MAs. The price trend of ETN has been quite flat until it rolled down below 50.0% Fib Retracement level. The red candlestick that led the ETN trend to turn bearish, and this led to lost support from the moving averages.
The technicals of ETN appear slightly bearish as the MACD and signal lines have turned below zero and hold a bearish crossover. The RSI lies at 39.47 and is nearing the support at 30 if the price of the coin drools even below the current support.
