


Tezos Gains Around 16% in Intraday Yet Trades Below $3.5

Tezos (XTZ), is trading at $3.21 after hitting a fresh 24-hour high at $3.317 just hours back before the press time. However, with intraday pullbacks and volatility, XTZ experienced a bearish crossover yet trades above $3 and 61.80% Fib Retracement level.
Despite being one of the top-15 cryptos of the global market, Tezos lacks all the momentum to trace its fresh high above $4 or even beyond $3.5. However, the intraday growth cannot be underestimated and, in this regard, XTZ price has rose from $2.83 to $3.31 which is an approximate growth of 16% in 24 hours.
Alongside, the entire crypto market is believed to be snapping in green as crypto gets the gush of attraction and has lured major networkers. The altcoin market along with Bitcoin is trading well as the latter breaches the year-long resistance at $11.6k. Additionally, all the major cryptos have breached stringent resistances while the networkers await XTZ to move beyond $3.5 and $4.
Ranked on the 13th position, the investors are surely looking forward to a great bullish breakout of Tezos sooner than later.
Tezos Price Holds $3.21 Despite Intraday Correction
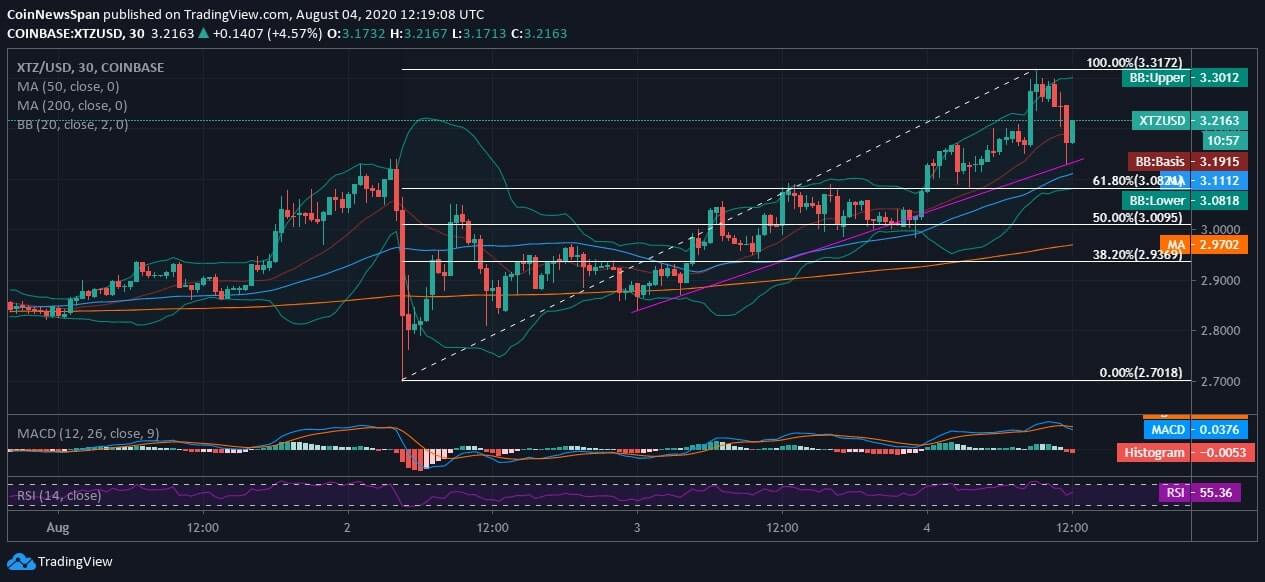
On the intraday chart, XTZ at the press time was trading at $3.21 and is also exhibiting an uptrend straight after the recent low marked at $2.7 after the beginning of the month. Despite lack of steady momentum, the intraday performance of Tezos cannot be underlined and the coin is retaining strong support from MA50 & MA200 at $3.11 & $2.97.
The price trend of XTZ/USD after breaching the upper 20-day Band is now drawing a slight bearish crossover. However, we also seen a bullish candle forming right besides the bearish candlewick. If the coin pulls back even further, it is likely to test supports around MA50 followed by breaching the lower 20-day Bollinger Band.
However, we do not project any trading extremities on the intraday chart as per the laid 20-day BB. Additionally, the Tezos price is still maintaining its stance above 61.80% Fib, but the intraday correction has led to real time bearish crossover on the MACD chart. The RSI has now fallen into the range as it lies at 55.36. The major support and resistance in the intraday lies at $3.0 and $3.5 respectively.