


Terra Turns Bullish; LUNA May Cross the Resistance of $104

The price of LUNA has declined towards its lows during the past few months; however, the coin has recovered from its lows since the end of the last month. There have been bullish price movements with few pullbacks in the last few days. The current momentum can push the price in any direction, and the price is trading at the edge of an uptrend line. The coin may turn around from the trend line or may decline further if it faces selling pressure. Yesterday, the bearish candle formed showed a decline of 4% in the Terra price.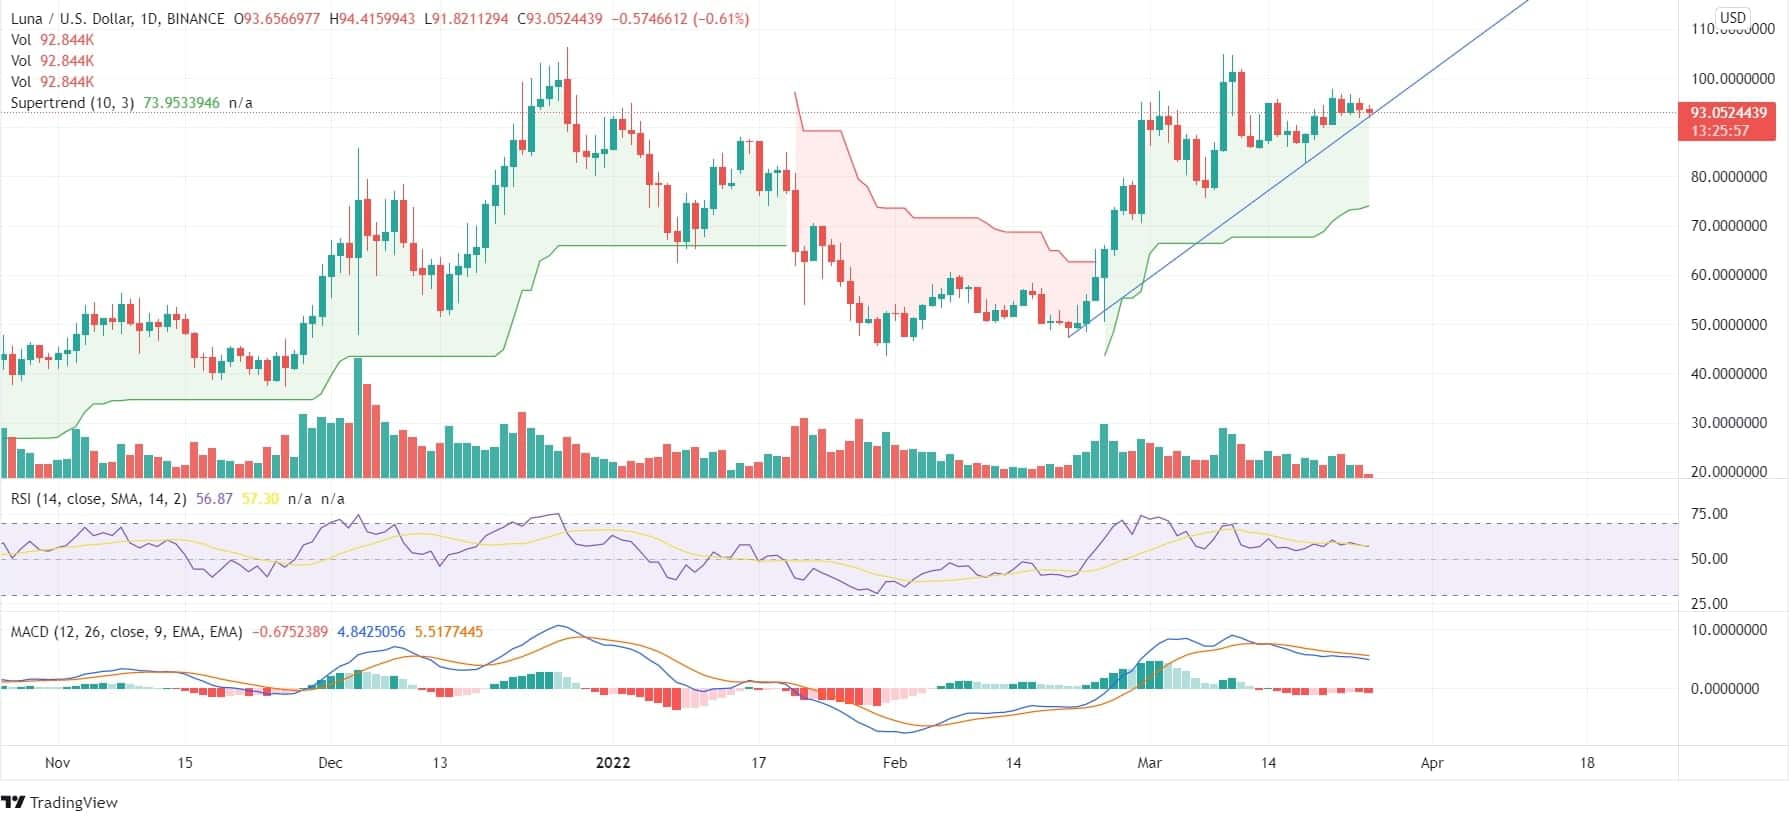 On the above chart, the super trend line moving below the closing price and the indicator turning green indicates a buy signal. The MACD line is below the signal line denotes a sell signal. However, once the price closes below the trend line, a confirmation of a downtrend pattern can be expected. The RSI indicator is 57, is currently neutral. Based on LUNA coin price prediction, A minimum possible price level of $106 can be expected if the price continues to ascend from the trend line.
On the weekly time frame, the last week’s price movement has registered an escalation of 15%. From the past five weeks, there has been the formation of bullish candles. The investors may enter the bullish trade if the price continues to ascend from the current level. However, a favorable bulls volume can be awaited for higher returns.