


DASH Drools from an Intraday High of $82 & Draws a Bearish Wedge

Dash draws an intraday bearish wedge as it falls from an intraday high of $82.1 to currently trading below $80, losing steady support from 50-day daily MA. The next immediate support is at $78, i.e., 200-day daily MA after raising above $78, in yesterday’s trading session. Apparently, the previous day’s session had been quite a gainer as DASH drew a subtle yet noticeable uptrend until volatility broke in.
Dash (DASH) Price Pulls Back After Resistance at $82
 CoinNewsSpan
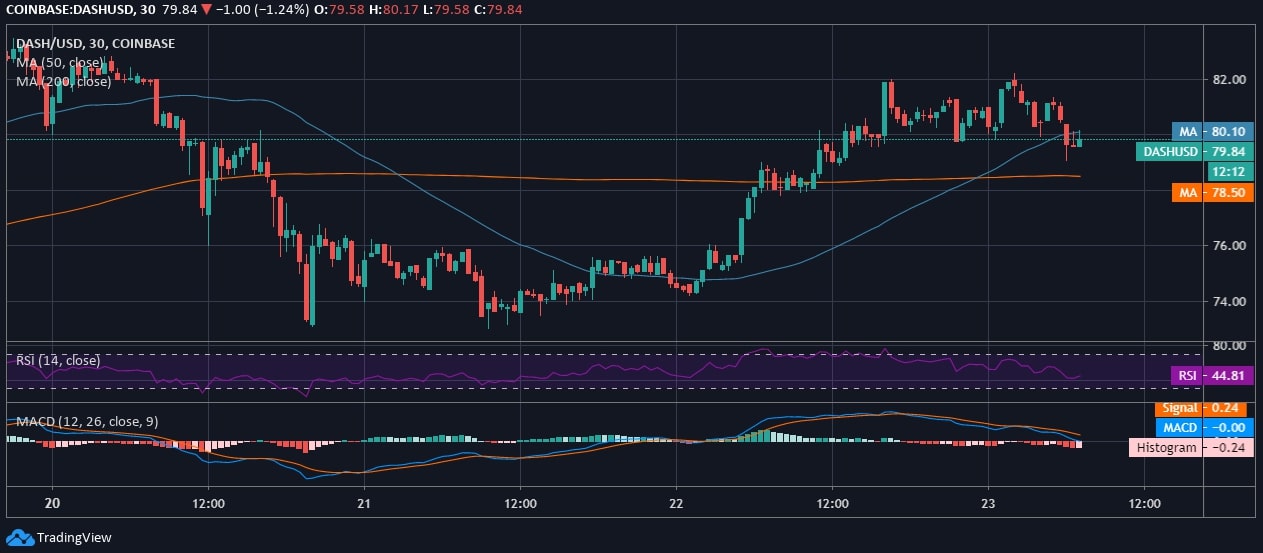
The half-hourly chart on Coinbase shows an intraday pullback as the candlesticks reverse after breaching the intraday resistance at $82. Otherwise, the 3-day resistance lies at $82.5, after which DASH immediately lost the intraday traction to plummet below $74, twice over the past two days. However, important to note that when there happened to be a “golden crossover” just at the onset of the day, today, on the half-hourly chart, we saw a green candlestick and an, unfortunately, a bullish trend aversion.
On the other hand, Dash has been giving a mix of trends supported by a price accumulation in less than three days. On the half-hourly chart, the price trend of DASH is going to be an intraday looser if it slides below $78 at any hour of the day.
The MACD of the coin holds a bearish divergence, and the signal line crosses above the MACD line due to loss of traction, and the RSI exhibits no extremities at 44.81.