
Litecoin, at the time of penning down this article, was trading below $50 around $46.31 with a lack of support from 200-day daily MA and slight support from 50-day MA. LTC/USD lost the bullish streak two days back and has been continually plummeting below $50 since then. Litecoin has marked a weekly resistance at $50.9 on the intraday chart, which remained unattained in the ongoing week.
Litecoin Price Analysis
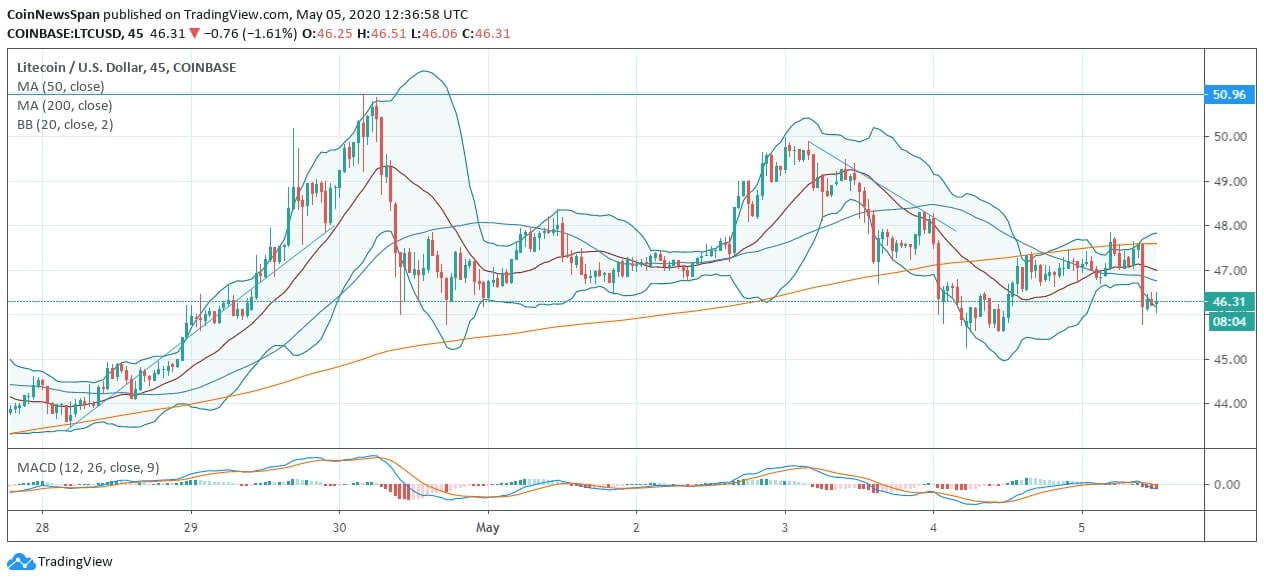
On the intraday chart, Litecoin broke the bullish consolidation after hitting around $50 with a weekly resistance lying at $50.96, attained after a notable uptrend at the beginning of the previous week. Due to bullish candlestick aversion, the price trend of LTC/USD broke below 20-day lower Bollinger Band and lost 50-day MA support. However, a dip below $45 will confirm the bearish consolidation due to intraday weak momentum against the US Dollar.
The 20-day Bollinger Bands so not exhibit unprecedented volatility, but the price trend of Litecoin is hitting below the lower band showing loss of intraday traction. The technicals are drawing a no profit no loss picture as the MACD, and the signal line appears flat with a slight bearish divergence due to intraday fall below $46 for a brief time period.