


GBP/USD Lacks Traction; 1.264 Acts as a Strong Resistance

GBP/USD on a half-hourly chart draws a downtrend after hitting close to 1.265 in a fortnight of bearish consolidation. Yet, this tuned out to be momentary as the Pound currently strikes at 1.252 against the American Dollar in the global markets. However, a move below 1.250 will confirm the total bearish divergence. The pair is currently trading around the daily lows and has marked a 24-hour low at the press time.
Technical Analysis: GBP/USD
 CoinNewsSpan
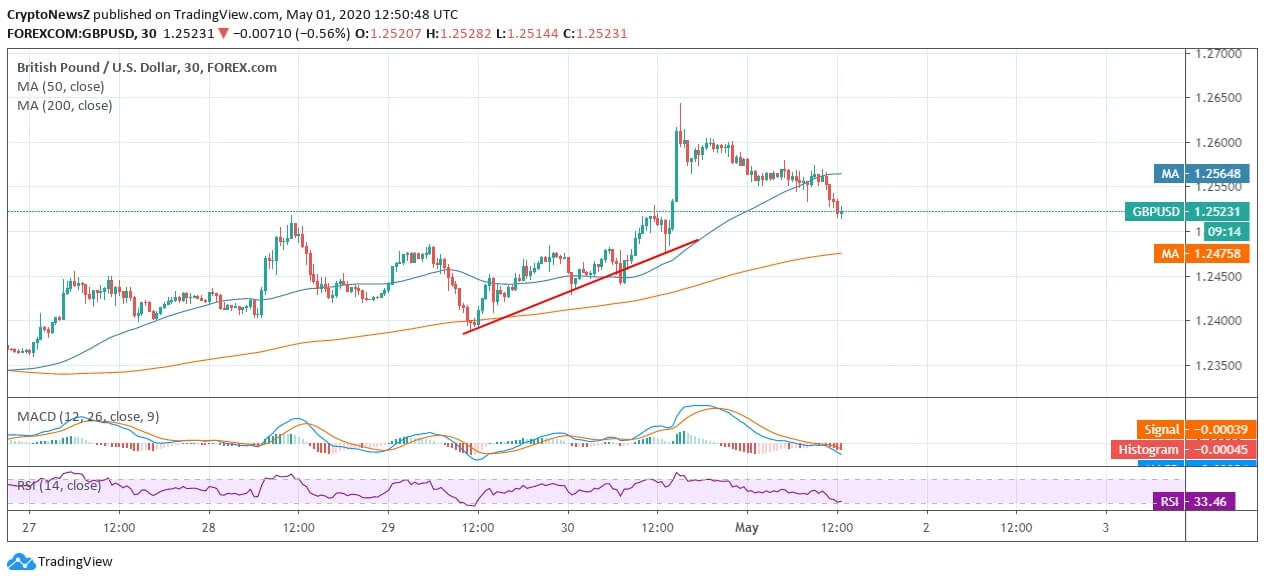
On the half-hourly chart, the Pound has notably rebounded from the previous week’s trading pace yet could not maintain a persistent trade above 1.26 and reclaims back to daily lows. On the intraday chart, the pair fails to retain support from 50-day MA but holds back 200-day MA support. Moreover, the intraday high at 1.264 is a double-top in April, which previously happened in the early half of the month and is posing as a strong resistance. A move above 1.265 will be a bullish crossover on the daily chart.
The technicals confirm the lack of momentum in the market as the signal line crosses above the MACD line after the coin failed to cross above 1.264, and thereby RSI holds around the selling zone at 33.46.