
Ethereum price boosted with a spike in BTC price as it released the consolidation range to breach above $9.5k in the past 24 hours. With this, the influential coins like DASH, Litecoin, XRP, BCH, BNB, etc. have gained notable traction. Bitcoin lagged when altcoins experienced a rush, and cryptos like Verge, VeChain, DigiByte, Cardano, etc., were hitting fresh highs with stupefying momentum.
Moreover, it was just two days backs when the most notable crypto critic Peter Schiff took to twitter to compare about the soaring change in the price of silver against Bitcoin. Well, Bitcoin is the massive crypto in terms of the market capitalization of the global crypto market, and ETH follows—which is the massive altcoin in terms of MCap and is ranked 2nd. Mr. Schiff has been stringently supporting investments in gold and silver, especially when compared to Bitcoin.
However, the major cryptos like Ethereum may appear consolidating with intermittent spikes and dips; the long-term overview is quite enticing.
Now, just as the comparison by this famous critic, it would not be wrong to compare Ethereum in place of BTC against the silver metal.
Ethereum price chart against the US Dollar in the above tweet is nothing but a reminiscence of silver price chart over the past decade now. The two have been rigidly moving, but ETH has marked a trend and pattern like silver in 3 years for which the silver market took a decade. This shows the growth and development of digital tokens amidst the traditional avenues in the market. Gold and silver have been existed for years now, while Bitcoin, Ethereum, and alike have made their way in over ten years to stand at par, which certainly shows development and magnification.
Ethereum Price Chart
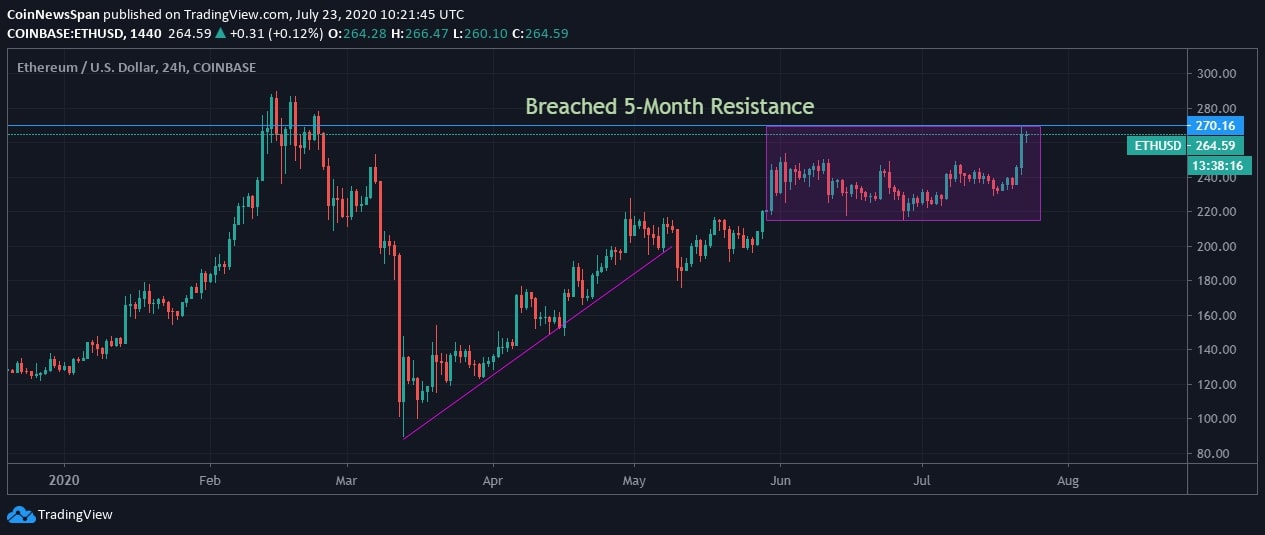
Ethereum, on the 24-hourly chart, is seen breaching a 5-month long resistance as it hit $270 momentarily around the press time and is currently trading at $264.5. After a notable uptrend followed by price consolidation of 2 months, ETH has now gained traction straight after the massive sell-off in March. The bullish candlewick in the intraday today has led to reversing the losses which otherwise were marked due to trading sideways for four months with the lowest YTD marked way below $100.
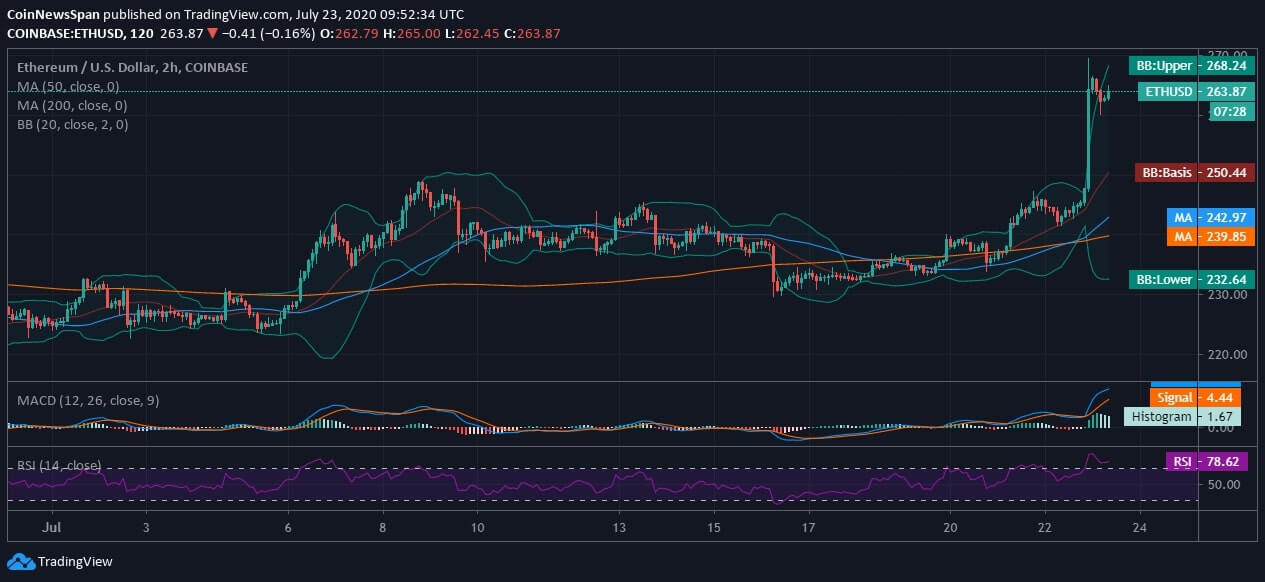
On the 2-hourly chart of ETH/USD on Coinbase, we see that the coin had hit a bullish candlewick at $270 with complete support from 50-day and 200-day daily MA. The 20-day Bollinger Bands are seen widening projecting volatility in the short-term. However, the technicals are bearish than ever as the intraday price rise has led MACD to cross above the signal line, and similarly, the RSI of ETH coin is hitting the overbought region at 78.62. ETH coin is experiencing a bullish wave after trading laterally and having a notable price accumulation. The major support and resistance for the currency to watch out for lies at $250 and $270, respectively.