


Bitcoin Floor Pattern Emerged Across Eight Metrics, Alphractal Says

A 90-day study of macroeconomic data and Bitcoin on-chain metrics reveals a pattern last seen in August 2024, when the market set a solid price bottom, according to analysis from Alphractal.
BTC On-Chain Conditions Point to Accumulation Phase
Monetary Policy Ceiling: The Fed maintained a 3.50–3.75% range of rates in April, though four members of the committee dissented — a level of split opinion not seen since 1992. The dissent is being read as a ceiling on hawkish positioning rather than a precursor to further tightening.
Dollar and Gold Signals: The dollar index sits near 99.4, a six-week peak. Historical mapping of 2023–24 price cycles shows Bitcoin lows forming within roughly two weeks of DXY peaks. The liquidity signature of gold that is trading around $4,600 is repeating, indicating general selling pressure among risk assets, but not necessarily for Bitcoin.

Exchange Supply Compression: Supply-side data tells a comparable story. Bitcoin held by exchanges has dropped to about 2.69 million coins, which is 5.6% of the circulating supply, and is at the lowest level of reserves in eight years. Over the last few months, some 170,000 BTC have been withdrawn from exchanges, reducing the amount of sell-side coins available to be released into the market for the distribution.

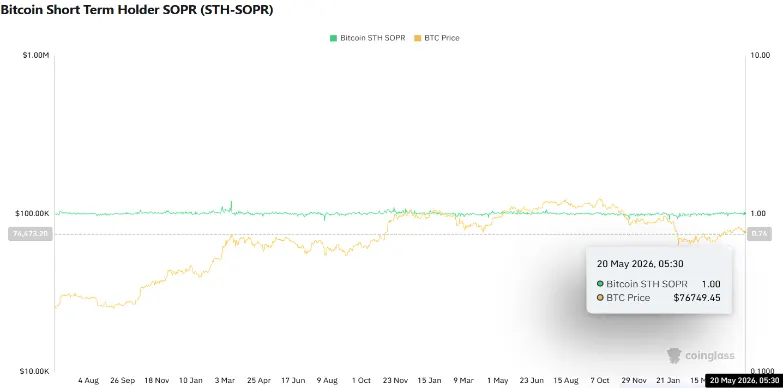
SOPR Breakeven Crossover: The Spent Output Profit Ratio, now project a reading of 1.0008, just above the breakeven point, and after been in negative territory in February. The chart illustrates that the crossings below the 1.0 line have corresponded to the end of bear-phase selling behavior in the past.

Short-Term Holder Capitulation: The short-term holder SOPR has rebounded from an average realized loss of around 7.85% in January, and is now at about breakeven, indicating that the most ‘at risk’ sellers have largely sold off.
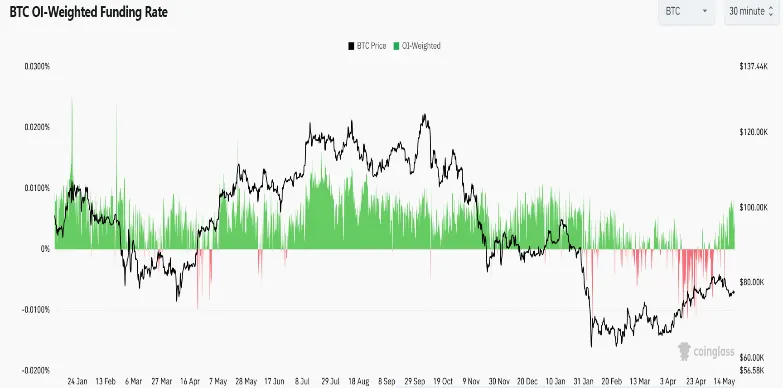
Derivative Positioning: The average funding rate of derivatives positioning has remained around +0.005% per eight hours for the last month, which is far from a sign of overleveraged long exposure. Rebuild of open interest since mid-May seems to have been spot-driven and not futures-led, eliminating one of the more usual triggers for a run of sharp liquidation cascades.
Whale Accumulation vs Retail Retreat: The entities identified as whales have now gathered around 270,000 BTC over the past month, the highest amount since November, while addresses classified as retailers have seen their activity decline.

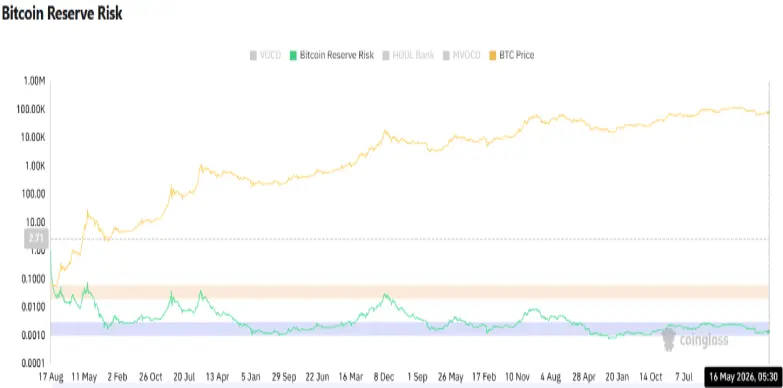
Bitcoin Reserve Risk: Bitcoin’s Reserve Risk metric currently sitting at green band indicate high conviction from these long-term holders (LTH), while the asset price is relatively low. Record-high 5y+ dormancy (33.14%) and rebuilding LTH supply are creating an intense supply squeeze.
Structural Convergence
Individually, these eight market indicators have hit these levels before, but mostly in their own pace. What makes the current reading so special is that they all look exhausted at the same time: monetary tightening is already over, speculative leverage hasn’t been significantly restored, the group most inclined to sell at a loss has done so, and the big holders are not selling but buying more.
This has been the case in past cycles as well, with this combination leading to a positive price outlook for BTC, not further declines. Whether that pattern holds will depend on how macro conditions evolve, but the on-chain structure entering this phase carries fewer of the warning signs typically associated with late-cycle euphoria or active distribution.