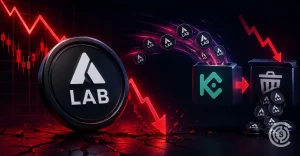
XRP Volatility Trends Compared to Major Altcoins
XRP is a digital currency that has volatility traits similar to other significant altcoins. Recent data show that implied and realized volatility are close to those of Solana during short periods, and slightly higher than those of Ethereum during brief spikes. Recent movements in institutional trading, driven by ETF rebalancing and increased options activity, have affected the short-term price ranges of many tokens, leading to momentary price fluctuations that spread across markets.
With a proactive view towards 2026, XRP price analysis in comparison to other currencies is important because traders can assess volatility to determine the size of positions they can take, set stop limits, and decide where the risk-adjusted value in the market lies.
Volatility Metrics and Methodology
The metrics and methodology on volatility for 2026 are based on three main metrics: historical volatility, which traces back the movements of the price; realized volatility, which counts the standard deviation of returns observed; and implied volatility, which comes from the pricing of options and indicates the expectations of the market. The realized and historical measures reflect the current situation across the exchanges and aid comparisons of assets with different liquidity.
Implied volatility indicates a market-priced range for future price changes. The options market has been growing in recent times, leading to an expansion of implied coverage for primary tokens. However, many altcoins still have shallow option liquidity, so the implied readings might be unreliable. Data quality varies by crypto exchange. Hence, the researchers clean the feeds and make adjustments to the fragmented order books. Regime transformations related to halving cycles, significant regulatory announcements, and changes in interest rate expectations can render short-term readings untrustworthy.
Historical Volatility of XRP
Ripple price analysis suggests that XRP’s long-term volatility may not be as pronounced but remains significant, with regime phases of rapid expansion during stress and gradual retreat in calm periods. The present realized volatility series shows very clearly that there are spikes associated with significant regulatory and liquidity events occurring sporadically, and the price movement most of the time is within multi-month ranges that are as deep as the order book.
The recent XRP price prediction suggests that most large XRP price movements are not driven by project-specific news but by broader market liquidity shocks, implying that XRP often moves in tandem with the broader cryptocurrency market. Differences at the exchange level have diminished as market makers were more active and increased the depth of their books, which in turn led to a narrowing of the cross-exchange spreads and a reduction in the baseline volatility. Historical data thus reveal a pattern of very rapid jumps when the risk-off pressure is at its maximum, followed by slower liquidity rebuilds, a pattern that traders should expect to see in 2026.
Volatility Comparison XRP versus Major Altcoins
As 2026 approaches, XRP’s 30-day and 90-day realized volatility is already positioned between Ethereum’s and Solana’s, as analyzed across the major trading platforms. Due to the deep options market and wide institutional flows, Ethereum is often more sensitive to macro factors and hence reacts more to shifts in monetary policy and interest rates. Solana, on the other hand, acts like a high-risk asset with more pronounced volatility, especially during risk-on periods, which tend to push its realized volatility higher than many others during bull runs. XRP usually maintains a tighter trading range, but its volatility does get to a higher level, which is indexed to large market flows and regulatory news.
The differences arise due to liquidity depth, maturity of the derivative market, and the narrative behind the different use cases. Out of the three, Ethereum has the most advanced derivatives ecosystem, which can price macro risk more efficiently, while XRP’s market maker concentrates on the payments narrative, allowing larger moves when liquidity changes occur. The traders in 2026 who use the 30-day and 90-day realized volatilities simultaneously will receive clear signals about the risks and be able to set positions based on each token’s average swings.
Cross Asset and Volatility Spillover Effects
The year 2026 will still see the continuation of volatility clustering as the shocks affecting one cryptocurrency market will, more or less, quickly be transmitted to other markets through cross-asset flows and leverage. The proof indicates that spillovers are not equal, with the strongest transmission occurring during risk-off moves, which are accompanied by rapid deleveraging that forces correlated selling across different trading exchanges. The division of exchanges remains an important factor, as trading on exchanges with shallow order books can lead to more pronounced short-term price movements than trading on exchanges with deeper order books.
The on-chain flows of stablecoins and the ETF rebalancing cycles are the major channels of transmission because the large conversions of stablecoins and the periodic trades by the institutions move the capital across the spot and derivatives markets, thus causing an increase in the intensity of short-term spillovers. The market makers are now smoothing over some of these effects, but sudden reallocations and large expiries can still cause rapid contagion across assets in 2026.
Recent Trends in XRP Volatility
According to recent XRP Price Analysis, XRP volatility increased, then subsided to an extent due to deeper liquidity and the presence of market makers replenishing order books. High-intensity event-driven movements caused volatility around primary regulatory news and very visible conferences, driving institutions to go up, while increased implied volatility increased trading activity.
However, at the same time, greater market maker activity led to narrower cross-market spreads that, in turn, reduced the baseline volatility that was usually present during the events. Investors’ uncertainty about macroeconomic conditions and the periodic rebalancing of ETFs led to trading volume spikes, keeping the near-term risk premium above very low historical levels. Therefore, traders will have to gear up for a higher baseline of short-term risk in 2026, characterized by liquidity and news flows.
Conclusion
The revised volatility profile for XRP price analysis towards 2026 shows a higher baseline of short-term risk, accompanied by more frequent spikes driven by liquidity shifts and significant news. Comparing XRP with its competitors provides better risk insights because differences in market depth, derivatives maturity, and use cases determine how shocks are transmitted differently across tokens.
The increasing options markets and the broader participation of institutional investors provide clearer implied signals, but at the same time lead to episodic rebalancing pressure. Keeping an eye on liquidity, the thickness of the derivatives market, and flows of stablecoins and ETFs will be the primary way to predict volatility events in XRP until the end of 2026. Position sizing and active risk controls will be the key for traders and investors, as they have been in the past.