



Chainlink Price Eyes Short Squeeze as Bears Dominate Open Interest

LINK, the native cryptocurrency of the decentralized oracle network, Chainlink, is down by 0.68% during Wednesday’s U.S. market hours to exchange hands at $9.3. This downtick followed a lack of recovery in the broader crypto market as Bitcoin extended its correction below the $75,000 mark. Furthermore, the falling Chainlink price gave a bearish breakdown below the support trendline of a classic bearish pattern called an inverted flag, amid an aggressive buildup of short positions in the derivatives market. Here’s how the increasing short position trade could impact the LINK price.
Chainlink Liquidation Map Shows $800M Short Stack Above $9.43
According to recent analysis from Alphractal, the latest liquidation heatmap for Chainlink shows a distinct positioning imbalance, with 54% of the open interest positions being short, as of May 27.
Three prominent short liquidation clusters are stacked overhead at the current price of $9.43, around $10.90, $11.29 and $11.48. The levels together are about $800 million in short exposure that may be forced to unwind if prices climb through those levels.
Below the current price, long liquidation support is thinner, with key levels identified at $9.01 and $8.44, representing a comparatively smaller buffer on the downside. A sustained drop below $9.01 could accelerate selling pressure as long positions begin liquidating in sequence.
The liquidation distribution sidebar shows $688.8M in long exposure against $800.2M in short exposure across the mapped range.
Accumulated net longs vs shorts data indicate that short positions dominated from late April through the 27th of May, with the imbalance becoming evident after the price decline around May 19, with the current setup especially susceptible to rising prices.
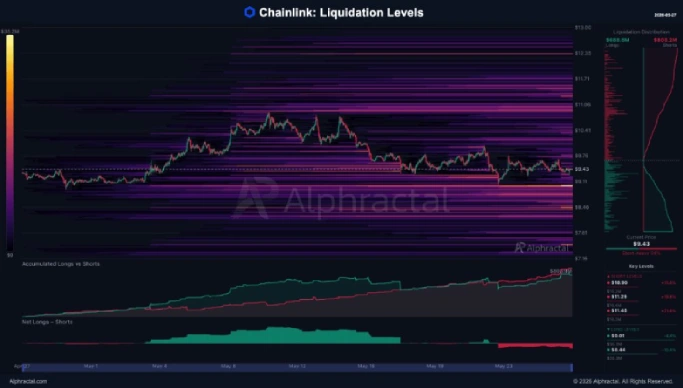
A move into any of these clusters would cause a cascade of liquidations, mechanically driving prices up as short sellers are forced to cover, and buyers will take up the demand.
Interestingly, Chainlink open interest (OI), projecting the outstanding value of outstanding futures and options contracts, has recorded a notable recovery this month. According to Coinglass data, LINK’s OI value has bounced from $366 million on May 3rd to $506 million at press time, registering a 38.7% gain.
Contrary to the price action, which lost all its gains from the first half of May, open interest was able to retain its value. This indicates that LINK traders are still holding leverage positions despite the significant volatility in price.
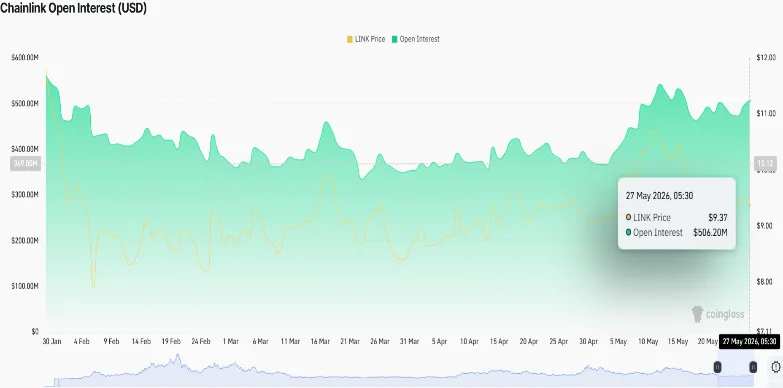
A sustained high value in this metric signals strong investor conviction in an upcoming, dynamic price move, which could potentially trigger the aforementioned liquidation.
Chainlink Price to Exit Month-long Recovery With this Breakdown
Following a sharp correction in January 2026, the Chainlink price has enjoyed a slow yet steady recovery for the past three months, resonating in an inverted channel pattern. As shown in the chart below, the pattern is characterized by a directional downtrend, followed by a steady recovery within two parallel trendlines that recoup the exhausted bearish momentum.
With today’s price drop, the Chainlink price gave a bearish breakdown below the flag support trendline at $9.376, and currently trades at $9.31. If the breakdown holds, the sellers could strengthen their grip over this asset and extend the current correction to $8.18 support, followed by the $7.68 floor.
Before the breakdown, the LINK price showed a short consolidation below the fast-paced exponential moving average of 20 and 50. Amid the anticipated correction, these two daily EMAs stand as initial threshold levels to signal a change in market sentiment.
However, a falling Average Directional Index (ADX) slope at 16 signals a weakening trend, suggesting that sellers have yet to establish clear momentum.
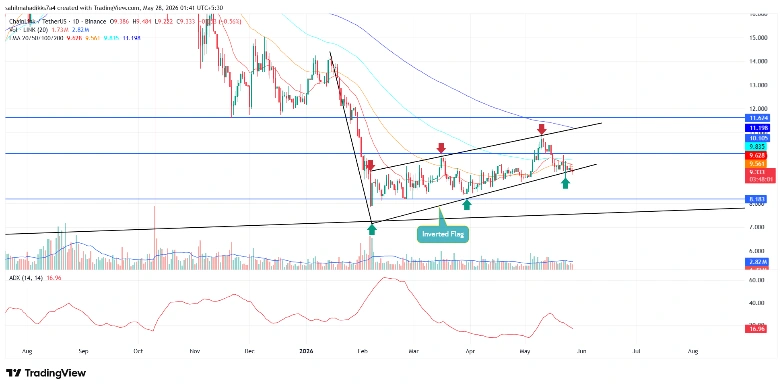
Having said that, if the price witnesses a swift surge within the channel pattern again, several factors indicate short-liquidation, EMAs control and a fake-breakdown scenario, with work in buyers’ favour to drive a stronger recovery.
