Stellar, one of the top 15 coins of the global crypto market, is seen trading at $0.154 after having nosedived as low as $0.109 on the 2nd day of the ongoing week. XLM coin started reflecting volatility after hitting a YTD high in the last week of the previous month. And as per the Stellar price prediction, with gradual lower lows, the currency tested monthly supports with the ongoing week’s bearish long candle formed on the daily chart.
Alongside, XLM is often compared to XRP that recently faced a lawsuit filed against itself by the SEC, and therefore, it led to a sharp decline and loss of over 50% in its trading value from the high of $0.45 to hit the ground bottom at $0.25.
However, the major catch here is that XLM and XRP are compared with each other on the grounds of investment and the return that each one of them fetches in the given time. But just when XRP price suffered a significant dip, XLM followed the similar sentiment and plunged from around $0.20 to testing supports as low as $0.109.
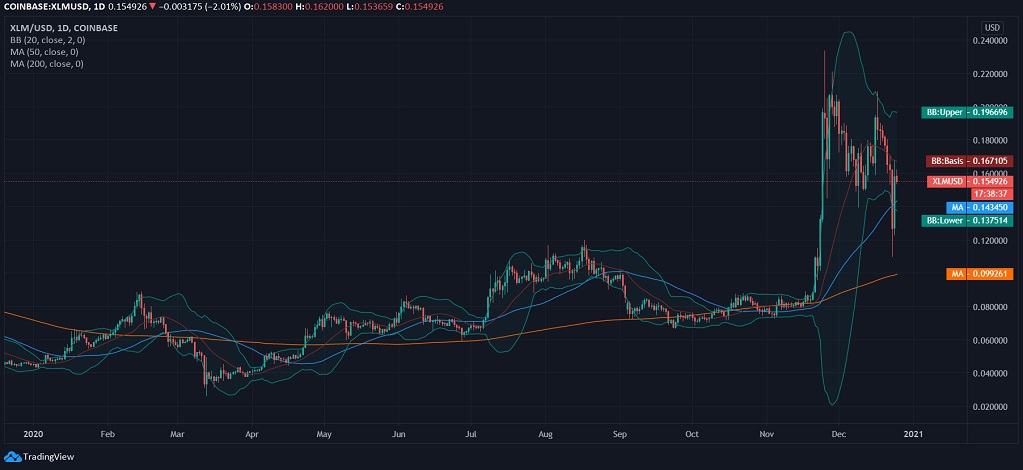
At the press time, Stellar price was seen recovering from the monthly lows after having crashed by over 45% in less than a week. XLM price strengthened after hitting the YTD low in March until the previous quarter, i.e., till August 2020. After a clear consolidation for approximately three months, XLM coin experienced a steep rise in the price.
However, with gradual correction, the price trend breached the lower 20-day Bollinger Band and tested 50-day daily MA at $0.143, well the price of XLM price reconciled above $0.15. The coin is retaining the 200-day MA support at $0.0992, and with a regain in the lost momentum, XLM is not likely to test 200-day MA.
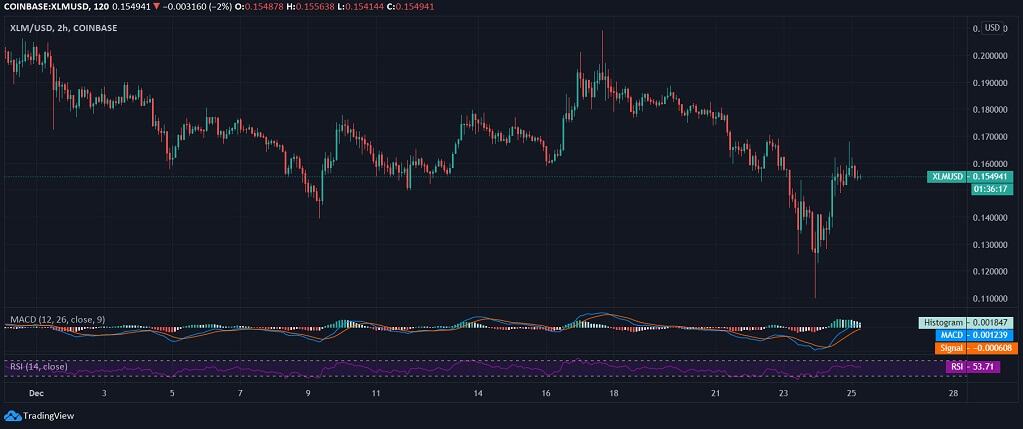
Moreover, Stellar has been the most volatile after hitting the YTD high in the previous month and having said that, it was just yesterday when Stellar price plunged, drawing a complete bearish divergence on the MACD chart. The RSI is away from hitting the extremities, lies at 53.71 after the price recovered from monthly support.