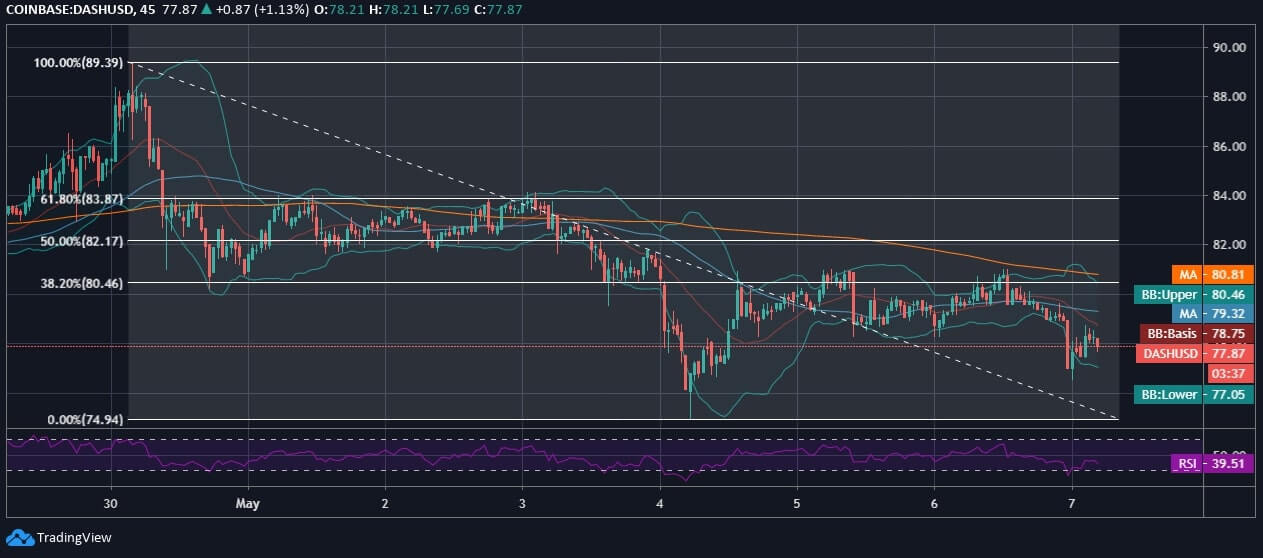
Dash, at the time of penning down this article, was trading at $77.87 after closing the yesterday’s trading session around $76.5. DASH/USD has failed to retain support from 50-day MA and 200-day MA after a gradual fall below $83 and a strong rejection around $81.
The bearish candlestick had already breached the lower 20-day Bollinger Band in the intraday when the coin had hit $76. Although, the 20-day Bollinger Bands are withholding no unpredictable volatility in the near-term, yet the coin in itself is moderately volatile.
On the intraday chart, DASH is giving consecutive lower lows with a weekly low marked at $74.9 and currently dips below 38.20% Fib Retracement level. Moreover, in the early half of the week, we have even seen a brief price accumulation until the price of Dash plummeted below 38.20% Fib Retracement level. After recording a weekly low, it rebounded on the same day to rise above $80, and since then, it has been oscillating between $77 to $80.
The RSI of the coin is seen drawing a slight uptrend after bottoming out below 30 in the selling zone due to intraday loss of traction, yet currently lies at 39.51. The major daily support to watch out for lies at $74, while the major resistance lies at $80 and $82. Moreover, the pair has been facing a strict rejection of $81 over the past three days.