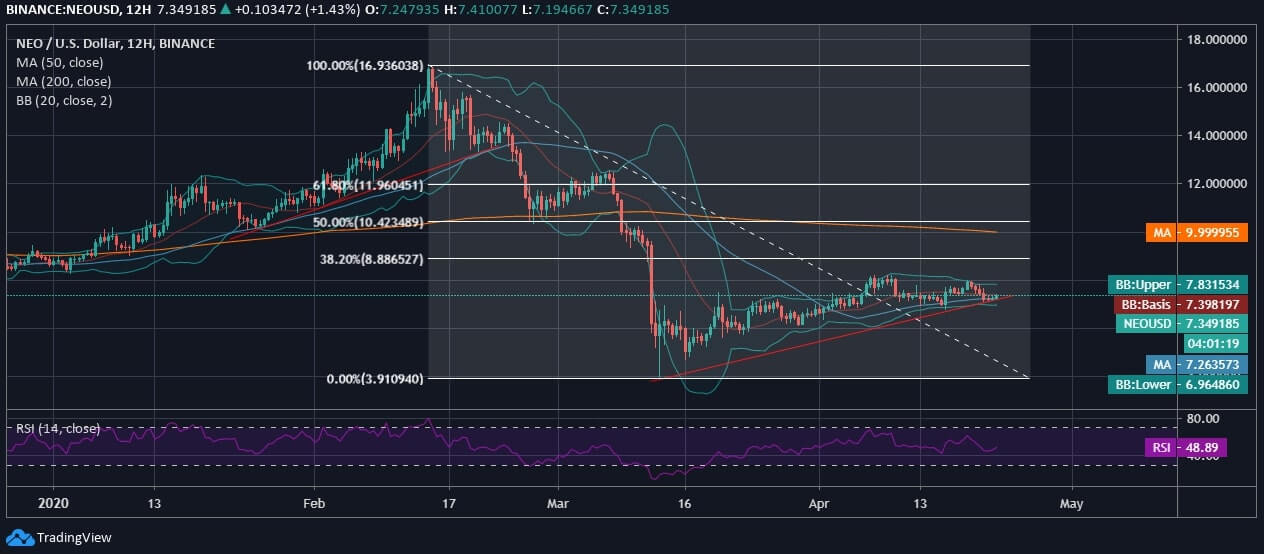
Neo (NEO), at the time of writing this analysis, was trading at $7.349 with squeezing 20-day Bollinger Bands. This rightly points that the trend of NEO/USD is likely to breach either of the 20-day Bollinger Bands, and as per the current momentum, we believe that the coin will breach the lower band. The price accumulation has taken the toll since the mid of the ongoing month and has notably retained support from the 50-day daily MA.
On the 12-hourly chart, NEO is having a price accumulation against the US Dollar while, on the contrary, it is also drawing a subtle uptrend. Over the past four months, the NEO price trend is experiencing a mix of momentums giving a yearly high at $16.9 and a low at $3.91 until the press time. Having said that, the NEO price slid down below 50.0% Fib Retracement level as it plummeted below the weekly support at $10. The steep fall took the coin to hit the utter bottom at $3.91, after which the coin has been undoubtedly retreating and gaining the lost traction. The coin is yet to gain support from 200-day MA as the price dips below 38.20% Fib Retracement level and is not likely to strengthen any soon.
The other technical indicator laid holds no trading extremities as the RSI lies at 48.89 and has risen from 40 after the price of NEO coin rebounded from $6.7 to trading above $7.