DigiByte, at the time of writing this analysis, was trading at $0.00717 and has steadily retained support from the 50-day and 200-day daily MA after it notably rose in the previous week. DGB/USD is trading moderately volatile as it nosedived below $0.0080 after hitting a weekly high at $0.00838.
Moreover, the king of cryptocurrencies—Bitcoin has also been experienced a price correction below $7k over the past 24 hours, and DGB price plummeted below $0.0070 to hit an intraday low and weekly support at $0.0067. DigiByte had taken a steep rise around the trading price of $0.0067 in the previous week when the trend reversal happened.
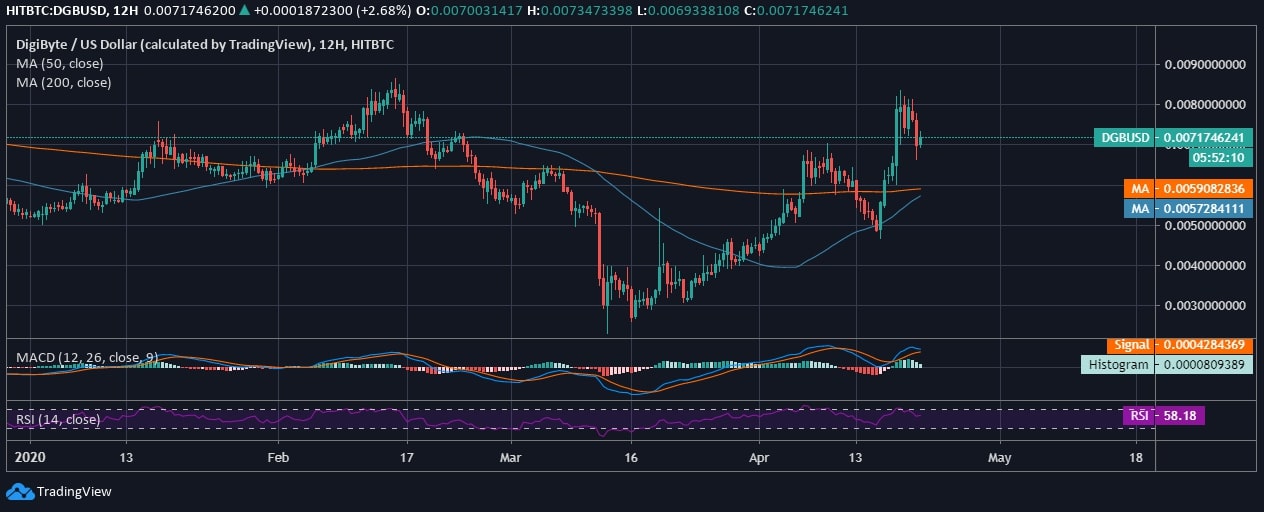
Analyzing the 12-hour chart of DigiByte against the US Dollar, we see that the coin has been experiencing a weekly uptrend until it plummeted below $0.0083. The coin has marked a yearly high at $0.0086 since the start of 2020, until the time of writing. Just when the market crashed in the previous month, DGB currency lost a substantial growth and nosedived below $0.0025 to rebound until the 1st week of the ongoing month. However, as the investment assets have been experiencing massive selloffs, DigiByte is no exception yet appears intraday bullish after it crossed above $0.0070 again.
The technicals give a similar idea as the MACD of DigiByte crosses above the signal line giving a bullish divergence, and the RSI slightly slid below 70 at 58.18.